- Home
- Our School
- Examination Results
Examination Results
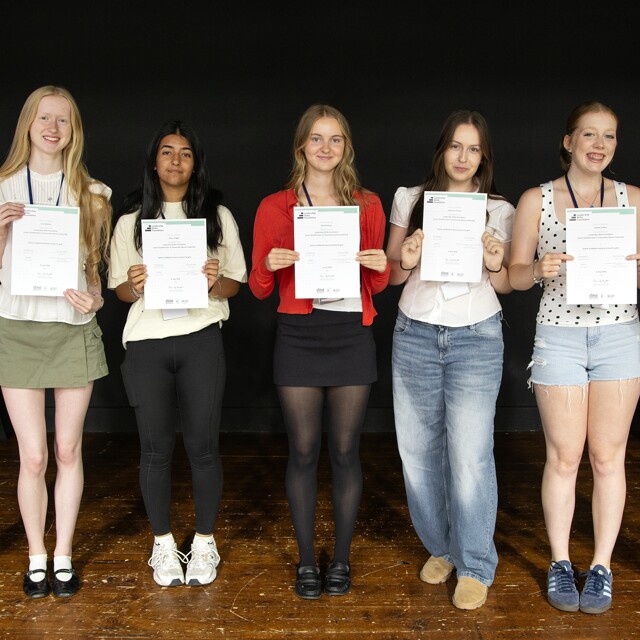
The achievements in GCSE and A-Level examinations are a culmination of sustained effort from students, expertise and guidance from teachers and support of parents and carers.
Here at Sutton Girls we value a broad and balanced education; academic success is combined with developing well-rounded, happy, resilient students who are ready for the challenges and opportunities in their future.
Alongside academic study there are numerous extra-curricular opportunities for students to enhance their wider skills. Students can get involved with sport, music, drama, Duke of Edinburgh scheme, fund-raising for charities, leadership opportunities, clubs and societies. Trips and residential visits allow students to experience life beyond school.
We are proud not only of our students’ academic results, but their achievements in a variety of fields and their contributions to the school, local and wider communities.
Dr B. Minards,
Headteacher
Our detailed Key Stage 4 Exam Results can be found on this page. Please also see the headlines below.
| 2023 | 2024 | 2025 | |
|---|---|---|---|
| Progress 8 score | 0.94 | 1.05 | N/A |
| Attainment 8 score | 78.6 | 80.9 | 79.4 |
| % of pupils achieving a grade 5 or above in GCSE English and Maths | 100% | 99.4% | 99.4% |
| % of pupils entering the English Baccalaureate (EBacc) | 42% | 64.8% | 48.6% |
| % of pupils staying in education or employment after KS4 | 98% | 97% | - |
We proudly support student choice within a broad and balanced curriculum, which is why EBacc entries may vary each year, as all students are free to select subjects beyond Maths and English that best support their individual passions and Post-16 pathways.
Please find a link to our performance data here.
Our detailed Key Stage 5 Exam Results can be found on this page. Please also see the headlines below.
| 2023 | 2024 | 2025 | |
|---|---|---|---|
| Average Point Score per A-Level Entry expressed as a grade | A | B+ | B+ |
| Average Point Score per A-Level entry | 49.08 | 43.2 | 44.2 |
| Retention | 99% | 98.2% | - |
| Destinations – Students staying in education or apprenticeships | 99% | 93% | - |
Given the uneven impact of the pandemic on school and college performance data, the government has said you should not make direct comparisons between the performance data for one school or college and another, or to data from previous years.
Please find a link to our performance data here.
News & Social